What is a fishbone diagram?
What is a fishbone diagram? It is a picture of a problem and its possible causes. The problem sits at the head on the right, a long spine runs to the left, and the causes hang off the spine as ribs, grouped under a few labels. The Wikipedia page on Ishikawa diagrams describes it as a causal diagram that shows the potential causes of a specific event, with major causes on the ribs and smaller causes branching off them, to as many levels as needed.
The name comes from the shape. Drawn out, a spine with ribs on both sides and a head at one end forms the side view of a fish skeleton. It also goes by herringbone diagram, cause and effect diagram and Ishikawa diagram.
The point of the drawing is not the drawing. It is the habit it forces: you list every cause you can think of before you pick one, and you sort them so that a whole area of causes is hard to forget. A problem journal such as Problem Graph keeps the other half of that work, the problem in one line with each solution tried on it and what happened.
Where the fishbone came from
The diagram carries the name of Kaoru Ishikawa, a Japanese quality engineer who popularized it in the 1960s while working on quality management in the Kawasaki shipyards. The Wikipedia page notes that the basic idea was already in use in the 1920s.
It later became one of the seven basic tools of quality, a short set of visual exercises for troubleshooting quality problems. They are called basic because people with little training in statistics can use them. The fishbone sits on that list beside the check sheet, the control chart, the histogram, the Pareto chart, the scatter diagram and the flow chart.
So the fishbone was built for factories and product defects. Nothing in it needs a factory, though. A problem, a few labels and a sheet of paper are enough, and the same steps work on a budget, a sleep schedule or a team that keeps missing deadlines.
The parts of a fishbone diagram
Every fishbone has the same four parts.
- The head. The problem, written as one plain sentence about what happens. "Grocery money runs out by Thursday" works. "Bad at budgeting" does not, because it already names a cause.
- The spine. A line from the head back to the left edge of the page. It only holds the ribs.
- The ribs. One per category of cause, each with a short label.
- The small bones. The single possible causes, written along the rib they belong to. A small bone can have its own smaller bones when one cause has causes of its own.
The head is the part people rush, and it decides everything else. If the problem sentence is vague, every rib fills with vague causes. Write what happens, when and how often, and leave out any guess about why.
Which categories go on the ribs
The categories are a prompt, not a rule. They exist so that you look in places you would skip. The Wikipedia page lists a few common sets.
- The 5 Ms, used in manufacturing: manpower, machine, material, method and measurement. Some add three more, mission, management and maintenance, for 8 Ms.
- The 8 Ps, used in product marketing: a set that includes product, place, promotion, people, process and performance.
- The 4 or 5 Ss, used in service work: surroundings, suppliers, systems, skill and safety.
The same page says the categories may also emerge as something unique to the case. For a personal problem the factory sets fit badly, so pick four or five labels that match your life. A set that works for many everyday problems is habits (what you do), people (who else is involved), tools (the things and apps you use), surroundings (where it happens) and timing (when it happens). Keep the count small. Six ribs with two bones each is easier to use than twelve ribs with one bone each.
A worked example: grocery money gone by Thursday
Here is a fishbone for a common household problem, built in five steps. The household plans to spend $120 a week on food and the money is gone by Thursday, three weeks in a row.
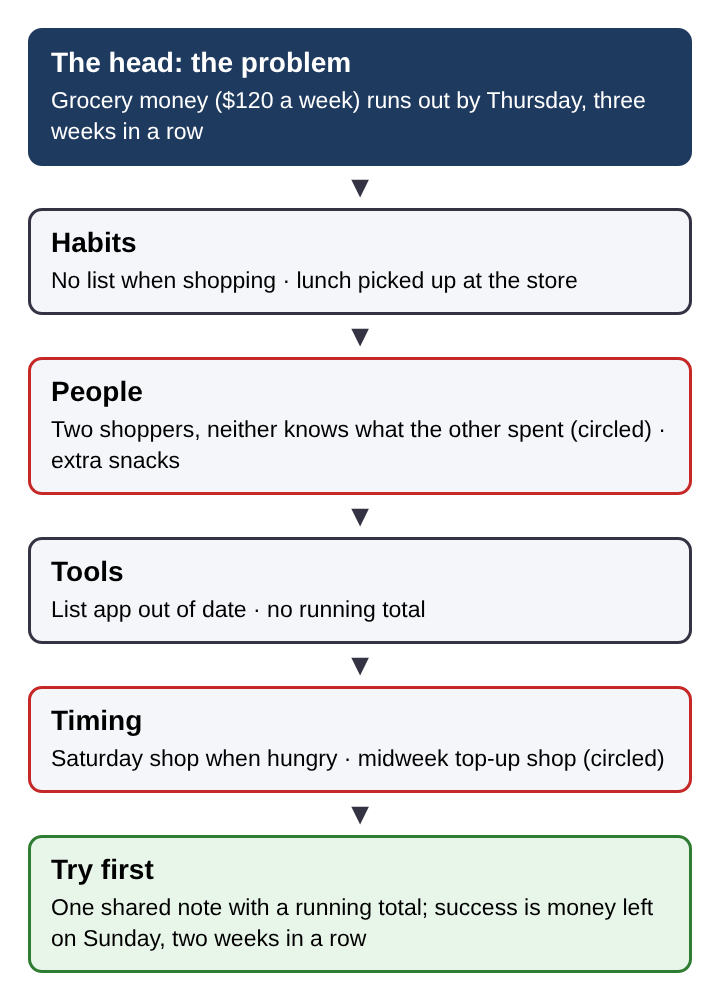
Step 1: write the head. "Grocery money ($120 a week) runs out by Thursday, three weeks in a row." It says what happens, how much and how often, and names no cause.
Step 2: pick the ribs. Four labels fit this one: habits, people, tools and timing.
Step 3: fill each rib without judging. Write every cause that could be true, even ones you doubt. The Wikipedia page notes that the causes often come out of brainstorming and are then grouped onto the ribs.
- Habits: shopping without a list; lunch picked up at the store on weekdays.
- People: two people shop and neither knows what the other spent; a teenager adds snacks.
- Tools: the shopping list app is out of date; there is no running total of what is spent.
- Timing: the big shop happens on Saturday when hungry; a midweek top-up shop always costs more than planned.
Step 4: mark the likely causes. Look at the receipts from the three weeks. Two causes show up on every receipt: the midweek top-up shop and the two people shopping without knowing what the other spent. Circle those two. The others stay on the drawing, because a cause you ruled out is still worth seeing next time.
Step 5: pick one to try first. Try the cheapest fix with the clearest result: one shared note where both people write what they spent, with the running total at the top. Write down the date you start and what would count as success: money left on Sunday for two weeks in a row.
That last step is where the fishbone ends and a record of the attempt begins. The drawing names possible causes. Only trying a fix and writing down what happened tells you which cause was real.
Fishbone diagrams and the five whys
The fishbone and the five whys answer different questions, and they work well together. The fishbone goes wide: it lists many possible causes side by side. The five whys goes deep: it follows one cause down a chain of answers until it reaches one you can fix.
The Wikipedia page on Ishikawa diagrams says each possible cause is often traced back to its root with the five whys. In the grocery example, take the circled midweek top-up shop and ask why it happens. Because the fridge is empty by Wednesday. Why? Because the Saturday shop buys for four days, not seven. Why? Because the list is written from what is missing, not from a week of meals. That last answer is a cause you can change. For more on running those chains, see what the five whys technique is and how to do a root cause analysis on a personal problem.
A good order is fishbone first, five whys second. Go wide to see every place a cause could hide, then go deep on the one or two that the evidence points to.
Where a fishbone diagram falls short
A fishbone shows causes side by side, as if each one acts alone. Real causes often feed each other. In the grocery example, the midweek shop and the two shoppers are linked: the second shopper is usually the one doing the midweek shop. The drawing has no line for that, so write a note next to the two bones when you see one.
It also says nothing about how much each cause matters. Every bone looks the same size. That is why step 4 uses evidence, here the receipts, to pick the likely causes rather than the ones that feel right.
Finally, a fishbone made once and thrown away teaches little. If the problem comes back in a month, you want the old drawing, the cause you tried and whether it worked, partly worked or failed. A fix that failed is useful too: it tells you which bone to cross off.
Frequently asked questions
Why is it called a fishbone diagram?
Because of its shape. The problem is the head, the long line to the left is the spine, and the categories of cause stick out from it as ribs, so the whole drawing forms the side view of a fish skeleton.
Who invented the fishbone diagram?
It is named after Kaoru Ishikawa, who popularized it in the 1960s in quality management at the Kawasaki shipyards. The basic idea was already in use in the 1920s.
How many categories should a fishbone diagram have?
Most use four to six. Manufacturing often uses the 5 Ms; for a personal problem, four or five labels that fit your life, such as habits, people, tools, surroundings and timing, are enough.
Is a fishbone diagram the same as a root cause analysis?
No. It is one tool inside a root cause analysis: it lists and sorts possible causes. Finding which cause is real still takes evidence, a chain of whys and trying a fix.
Using a fishbone diagram on the next problem that repeats
The fishbone earns its place on problems that keep coming back after a quick fix. Those are the problems where the first cause you thought of was probably not the only one. Write the head as one plain sentence, pick four or five ribs, fill them without judging, and let evidence circle the likely causes. Then try one fix, write down what happened, and keep the drawing. The next time the same problem shows up, the bones you already crossed off save you from trying the same thing twice.
Problem Graph
Every problem you carry, on one map. Solved together. Visit problemgraph.vlvd.net